
An operational dashboard in business software should help someone decide what to do now: assign an enquiry, investigate a delay or obtain missing data. Shared definitions come before charts. For each metric, specify what it counts, its source, when it updates and which list of records allows a person to verify it.
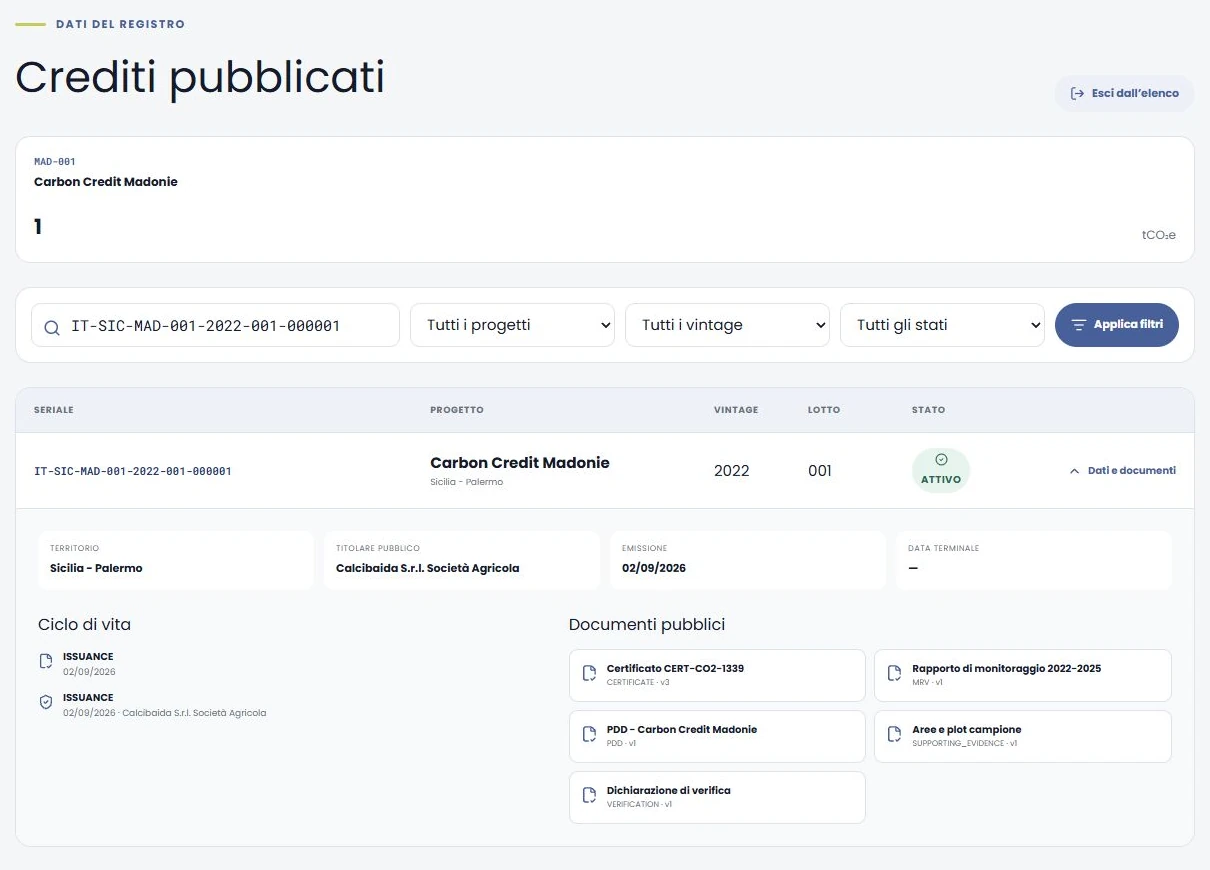
Cover: an authentic Carbonetica catalogue screenshot from the authorised archive, filtered to one serial with its data and documents expanded. This is a real browsing view, rather than the internal dashboard described in the examples below.
Start with one person’s work queue
Ask the operational owner which decision they make at the start of the day and which information they need to find. “I want to see everything” does not define a feature. “I need to find open cases without an owner” makes the data, filter and next action identifiable.
A management dashboard may track monthly performance. An operational view should connect the summary to the case requiring attention. These needs can coexist, but separating them helps. Microsoft’s dashboard design guidance recommends choosing information around the audience and its decisions. That is a design principle, not a requirement to use Power BI.
Write a definition for every metric
- Question: which decision does it support?
- Rule: which records are included or excluded, and for what period?
- Source: where does the data originate and who confirms it is correct?
- Freshness: how often does it arrive and how will an error be recognised?
- Detail: which list explains the displayed number?
- Action: who can act, and on which record?
For “overdue cases”, for example, decide whether a case closed yesterday is counted today, which time zone governs the deadline and how to handle a missing date. An approved definition prevents two departments from giving different counts the same name.
A small example you can calculate by hand
Imagine six fictional cases observed at 09:00 on 18 November 2026, Rome time. Define an overdue case as an open case with a deadline earlier than 09:00. Two open cases were due on 17 November; one open case is due on 19 November; one is open without a deadline; two are already closed.
The dashboard should show two overdue open cases and one open case without a deadline, separately. Exclude the closed cases. Clicking the first number should open exactly the two cases due on 17 November. These are not recommended thresholds or client data: they form a small test set for checking the rule.
If a count covers only one department, its detailed list must use the same scope. When the department or observation date changes, labels and values should change together.
Distinguish zero, stale data and unavailable data
Zero overdue cases means the calculation succeeded and found none. An unreachable source means the result is unavailable. Displaying zero in both situations hides an operational problem.
Agree a message showing the last successful update time and the person responsible for recovery. If the last valid value remains visible, make its age clear. Microsoft’s data refresh documentation distinguishes loading source data from refreshing views. Verify the complete path in your project. “Real time” is meaningful only when update frequency and delays have been defined and measured.
Design the detail, permissions and phone experience
A number should lead to a readable list with status, owner and next action. On a phone, prioritise urgent work and leave secondary information in each case. Do not rely on colour alone: accompany a status with a clear label.
Aggregated data can reveal restricted information. Define what each role can see in summaries, details and exports. OWASP recommends checking authorisation on every request: hiding a button or filtering a table in the browser does not replace server-side access control.
Ask for consistency checks before launch
Use test data and compare each number with its source records. Test a newly closed case, a missing deadline, an unavailable source and a user without access to the department. Write the expected outcome before running the check. Keep the approved metric definition too: a later change to its formula changes the meaning of historical comparisons.
To organise those checks, read our guide to custom software acceptance testing. For the wider project, start with business software requirements, MVP and testing.
Planning a dashboard for your custom business software? Bring one everyday decision, an anonymised example list and the data source. We can assess whether to improve an existing view, connect tools or develop a dedicated workflow.